Which defects intersect the design?
A defect map gives locations. Interpreting those locations requires knowing what was being made: a defect between device features poses a different question from one that overlaps a patterned structure.
At HRL, I developed a system that registers inspection coordinates to semiconductor layout geometry and tests defects for intersection with design features. Spatial indexing and geometric operations turn a collection of detections into a basis for investigating potential yield impact.
The analytical core began as a Python package and was later connected to a web application. Keeping the algorithms separate from the interface made them reusable across analysis workflows.
Worked example: synthetic geometry.
Consider a die containing three simplified layout features and an
inspection result containing four defect detections. Each defect
arrives as an (x, y) location in the inspection
coordinate system.
The analysis first transforms those coordinates into the layout coordinate system. A spatial index identifies nearby design polygons, and geometric intersection then determines whether each defect overlaps a feature.
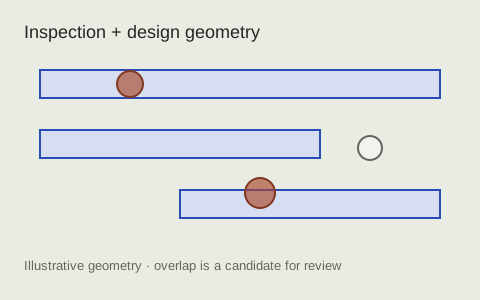
- Two defects intersect patterned features: D1 with A and D2 with C.
- One defect, D3, falls in open space.
- One defect, D4, lies near feature C but does not intersect it.
The output is therefore not simply “four defects.” It is a structured result linking the two potentially consequential defects to the specific design features they intersect. Geometric overlap identifies candidates for further analysis; it does not by itself establish electrical failure.
Validation against an established engineering review.
I validated the production implementation against the existing Excel-based review performed by a senior engineer. For equivalent inputs, the automated pipeline reached the same engineering conclusion while reducing an hours-long manual analysis to seconds.
The comparison checked that automation preserved the judgment of the established workflow. Engineers could then evaluate defect impact repeatedly across a dataset, instead of treating each analysis as a separate manual exercise.
Image registration and spatial matching.
I developed image-registration and mosaic-processing tools around optical inspection coordinates. The work required sorting out stage-position errors, calibration differences, overlapping fields of view, and illumination changes before treating disagreement between images as a sample feature.
For comparisons between point maps, I used forward and reverse nearest-neighbor searches and retained mutual matches to reduce ambiguous assignments. The physical correspondence being sought determines how a match should be defined and checked.
Reusable inspection libraries and applications.
I built a Python desktop application for exploring inspection scans, imagery, defect coordinates, and classifications. A reusable SQLAlchemy database library brought the related records into a coherent interface for analysis, with separate packages for tasks such as mosaic generation and data export.
The work extended through PyQt interface development, standalone executable packaging, and internal package distribution. Other engineers could use the application, while developers could reuse the underlying data and analysis libraries.
Keep the measurement in the feedback loop.
These tools sit alongside my work on metrology calibration, recipe qualification, and statistical process monitoring. Choosing a meaningful monitor metric requires understanding how the instrument behaves and how its measurements will be used.