Start with the decision the measurement must support.
At Transphorm, I owned a Candela 8520 optical inspection system and developed the analysis software around it. My responsibilities covered maintenance, inspection recipes, data analysis, and production support. The instrument produced detailed measurements; turning them into dependable wafer dispositions required a way to distinguish consequential defects from benign features.
Critical defects could be rare, while benign features generated many detections. Candela supplied multiple optical channels, correlated defect attributes, and a rule-based classification engine. I built the methodology and supporting software for developing, reviewing, and maintaining useful rules within that system.
Build a training set engineers can inspect.
The initial classifications were not reliable enough to serve as training labels without review. I used Python and Pandas to harvest historical defect examples across inspection runs, retaining rare defects while reducing the population of common examples to a manageable review set.
Each tabular detection was connected to its location in the optical imagery. My image-processing tools generated defect-centered thumbnails across channels so I could examine the physical feature behind a row of measurements and assign or correct its label.
Clustering, discriminant analysis, and predictor screening in JMP helped identify unusual examples and questionable labels. A statistical disagreement prompted another look at the imagery; it did not establish that the original label was wrong.
Turn reviewed examples into explicit rules.
For a selected defect class, I developed JMP scripts that examined its observed attribute ranges and ranked candidate restrictions by how effectively they excluded other classes. I could inspect the distributions, adjust a range to allow for expected variation, accept a restriction, and repeat against the competing examples that remained. The scripts recorded the resulting rules.
When a physical defect class had several distinct appearances, clustering helped divide it into more coherent subgroups. Several simpler rules could then describe the different appearances of the same defect type. Class priority also mattered when rules overlapped.
The result was statistically guided rule development with engineer review. The rules were expressed in Candela’s existing recipe language and transferred into its recipe editor. Matching reviewed training examples was a development check; performance on subsequent inspections still needed evaluation.
Synthetic example / Successive rule selection
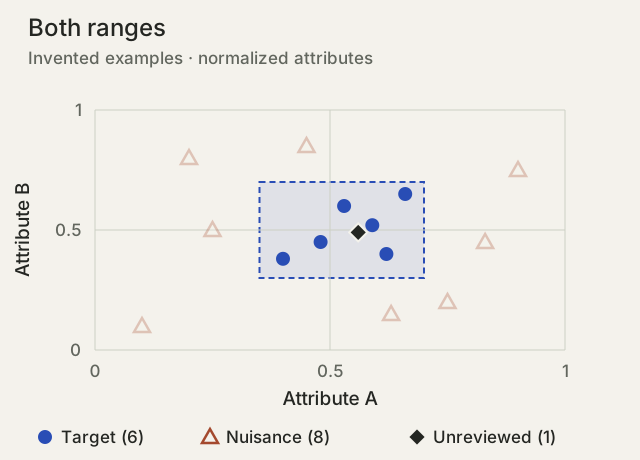
Both ranges retain 6 target examples and exclude all 8 nuisance examples. The unreviewed example also passes and still needs image review.
Keep image processing connected to physical geometry.
The instrument’s radius–angle imagery needed to be useful both as a wafer view and as a source of local measurements. I built tools to convert it into Cartesian wafer views, extract thumbnails at physical defect coordinates, and produce channel-specific views that made particular structures easier to examine.
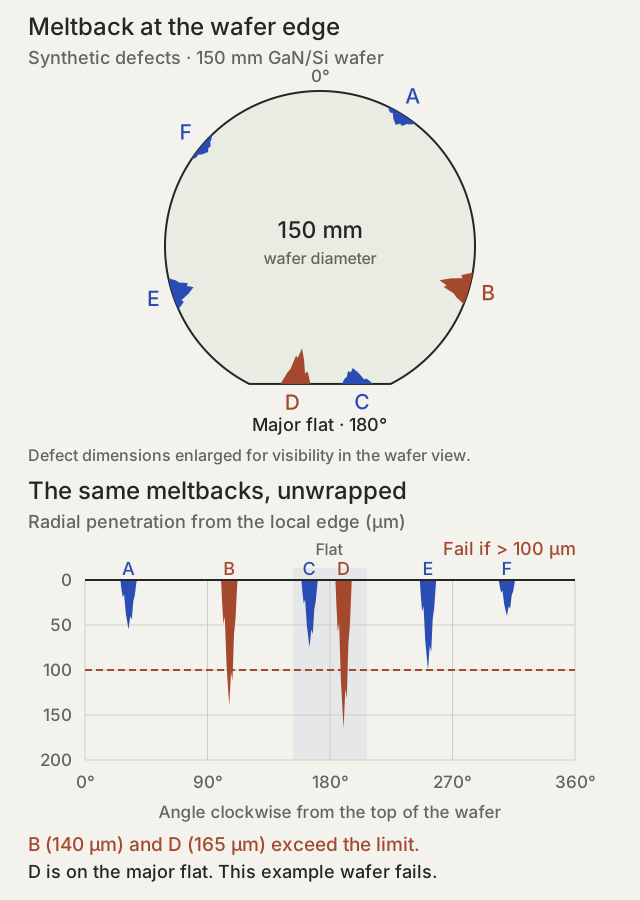
I also estimated the wafer boundary from imagery and used that boundary to unwrap the edge for inspection and measure inward defect penetration. The coordinate transformation was part of the measurement: a feature’s location and distance from the wafer edge needed to remain physically meaningful.
An important example was meltback, a defect caused by an unwanted gallium silicide side reaction during GaN growth on silicon in the MOCVD reactor. Meltbacks often appeared at the wafer edge. Our 150 mm wafers had a major flat, and any meltback penetrating more than 100 µm inward from the local edge failed the wafer—including defects on the flat. Referencing the actual boundary made that criterion meaningful around the entire wafer.
Carry the result into a production decision.
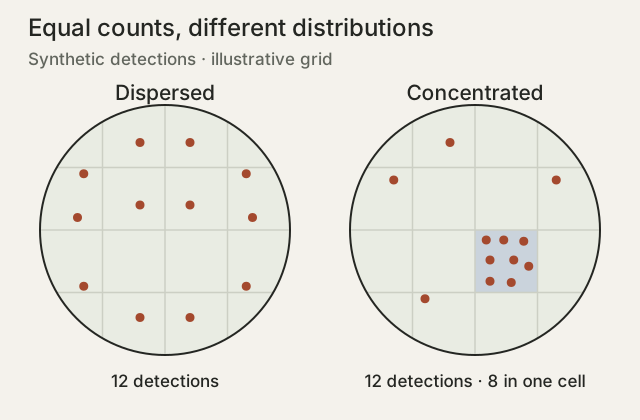
Defect identity, location, and distribution all mattered to grading. A critical defect could warrant review on its own; other populations were assessed through counts or density within local regions. A wafer-wide total alone could conceal a concentrated problem.
A useful classification also needed to remain connected to the correct wafer, inspection run, and engineering record. I built the Python pipeline that carried those relationships from instrument exports into the existing SQL data systems. It combined reports, reconciled wafer identifiers, and prepared manageable images for review, with handling for incomplete exports and unavailable imagery.
Validate the grade, then investigate the next disagreement.
I compared automated results with engineer-reviewed defect populations and known wafer dispositions. Investigating false accepts and false rejects connected recipe development to the consequences of a grading decision. Reviewed examples from those investigations could be added to the training set and used in subsequent rule revisions.
The resulting system achieved greater than 95% wafer-grading accuracy against the reviewed dispositions and saved more than 1,000 labor hours per year. Engineers could focus on exceptions instead of manually grading every wafer. The deliverable included a repeatable way to investigate the next disagreement and improve the workflow.